Density-safe collaborative transport, for a team
This paper presents a hierarchical density-based model predictive control framework for safe collaborative manipulation by multiple quadrupedal robots. The framework enables a team of robots to push a shared object to a desired pose using only the initial and goal poses, without requiring a precomputed reference trajectory. A centralized box-level MPC optimizes contact forces while enforcing a control-density constraint for goal convergence and obstacle avoidance. Each robot then solves its own distributed robot-level whole-body MPC, under a stated shared-information assumption, to track its moving contact location while accounting for static obstacles and the time-varying positions of neighboring robots. The approach is evaluated in MuJoCo using whole-body contact dynamics for two and three Unitree Go2 quadrupeds collaboratively pushing rigid objects through narrow passages. Comparisons with matched Control Barrier Function (CBF) MPC and RRT*-plus-tracking baselines demonstrate the effectiveness of the proposed density-based formulation for push-only, force- and torque-coupled manipulation tasks.
Hierarchical, density-safe architecture
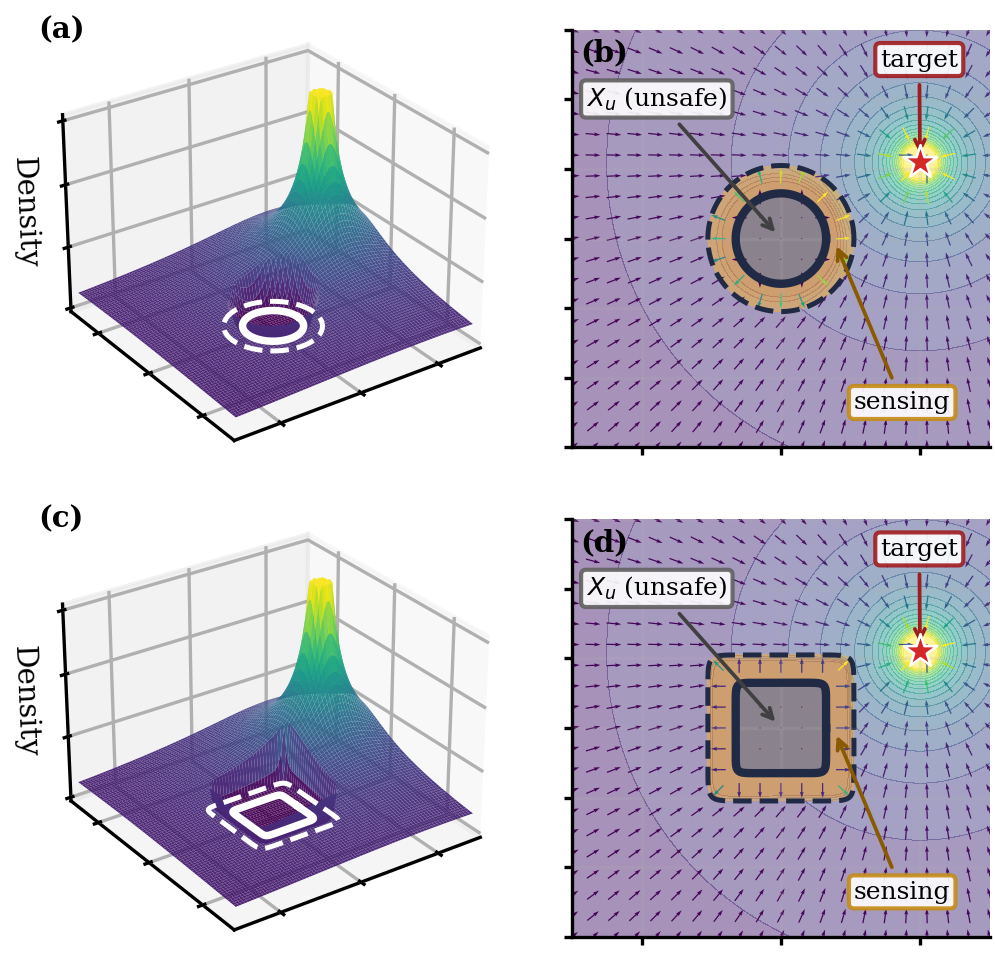
A box-level density MPC plans each robot's push force and contact offset from only a start and goal pose; a robot-level density NMPC then tracks its assigned, moving contact point on real Go2 whole-body and contact dynamics. Both levels certify safety through the same control-density-function formalism, evaluated against a live, per-step unsafe set that folds in static obstacles and — at the robot level — teammate positions.
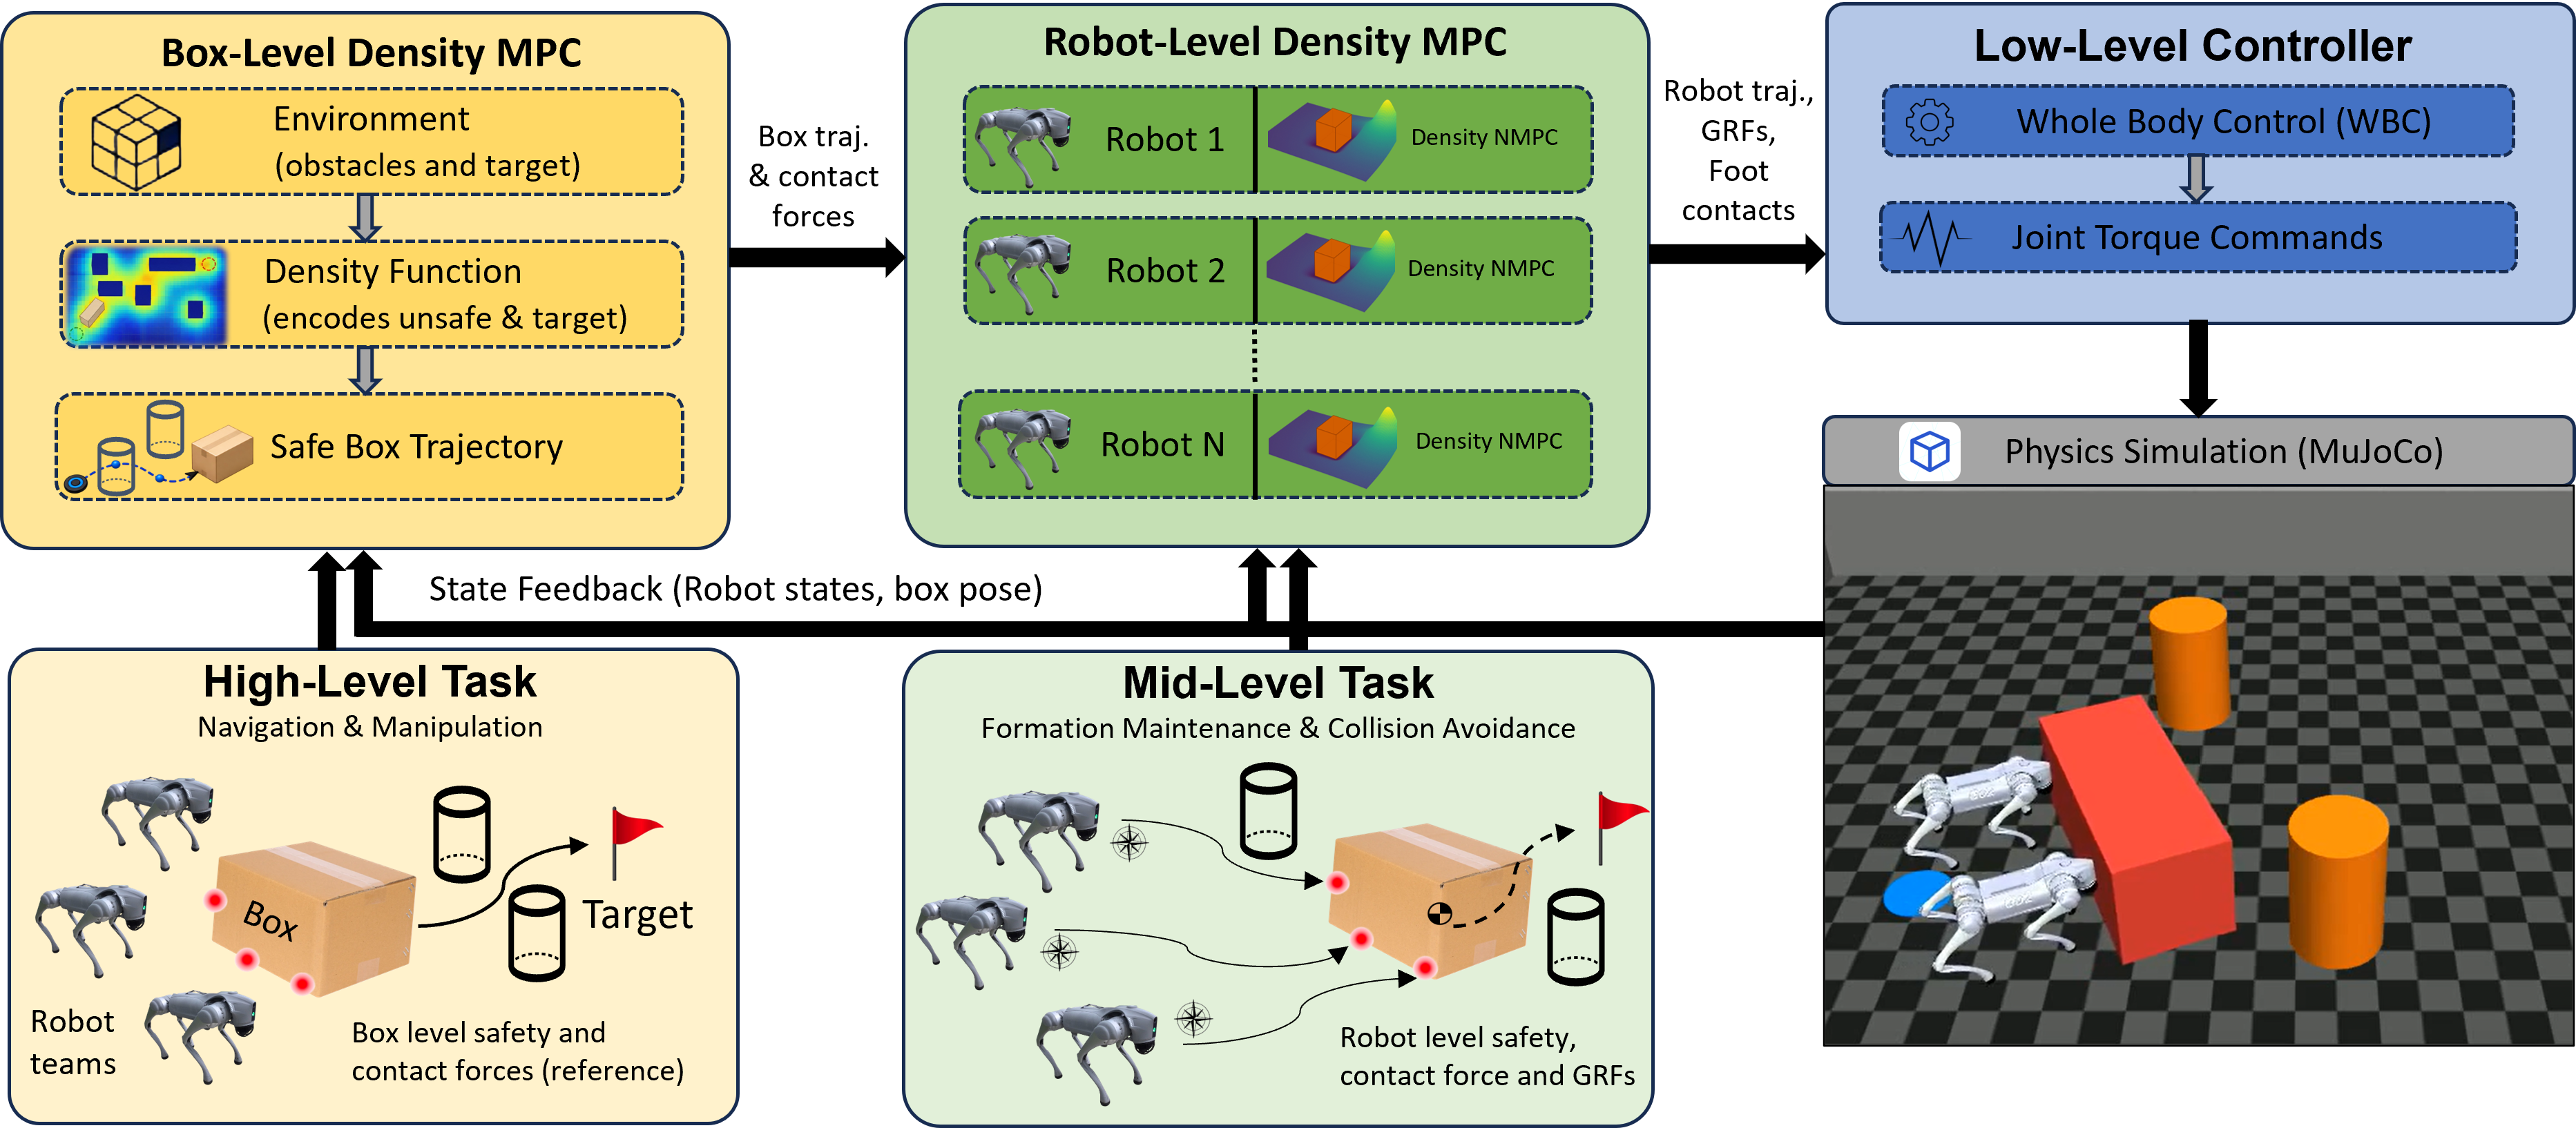
Simulated on an AMD Ryzen 9 5900X with a 2 ms MuJoCo integration step. The box-level MPC is formulated in CasADi and solved with IPOPT (15-step horizon, 0.05 s discretization, 20 Hz design rate); each robot-level MPC uses acados with sequential quadratic programming (12-step horizon, 0.02 s discretization, 100 Hz design rate).
The two hardest evaluated scenarios
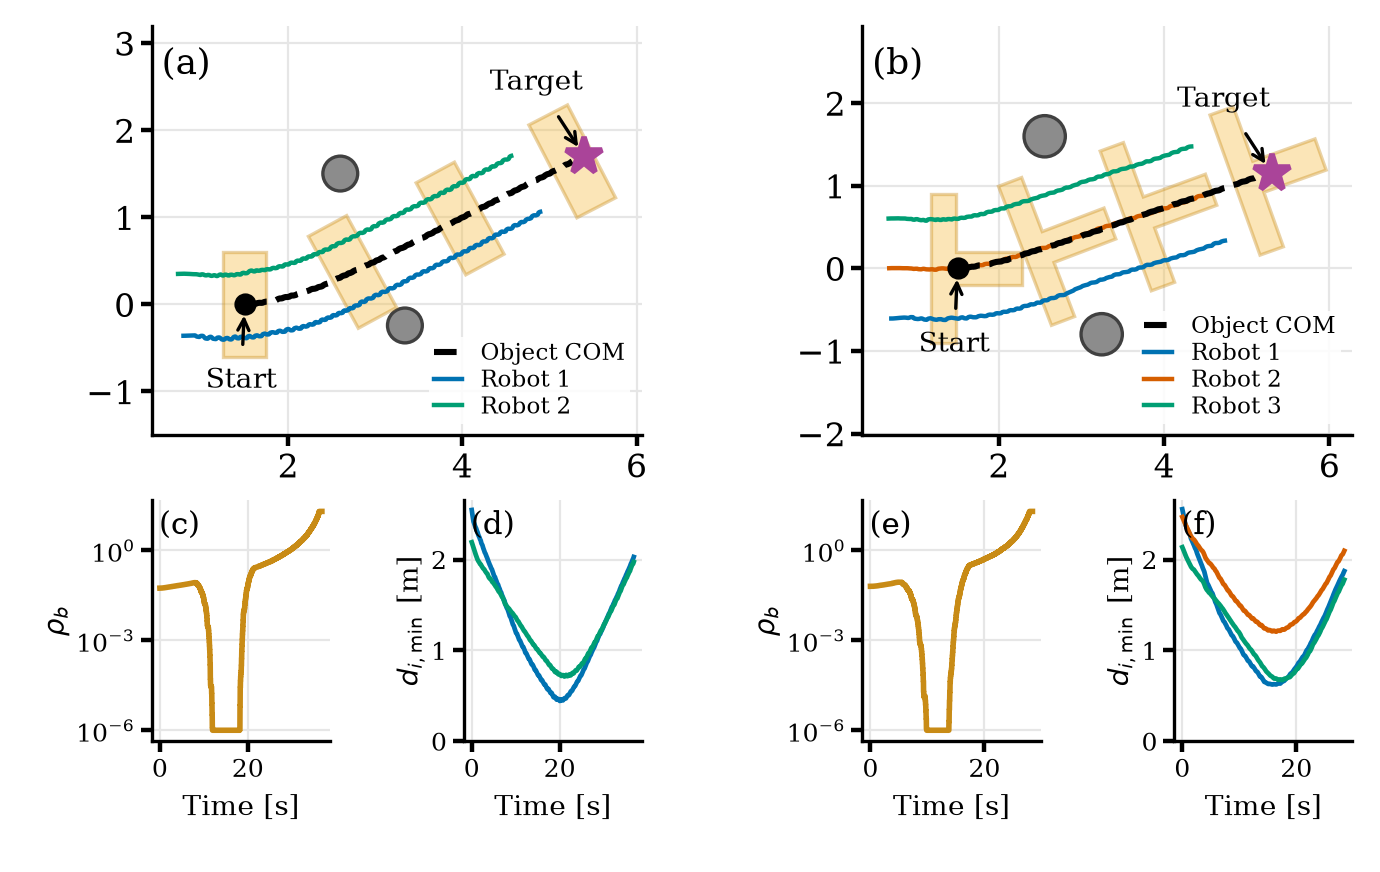
Both scenarios push a box between two static obstacles at a heading matching the corridor diagonal, inside a closed rectangular boundary wall, on real Unitree Go2 robot-level NMPC and contact dynamics — not a kinematic or single-rigid-body approximation.
Dual-quadruped — N=2 robots, gap D = 1.90 m
clearance 0.02 m · t_conv 38.6±0.8 s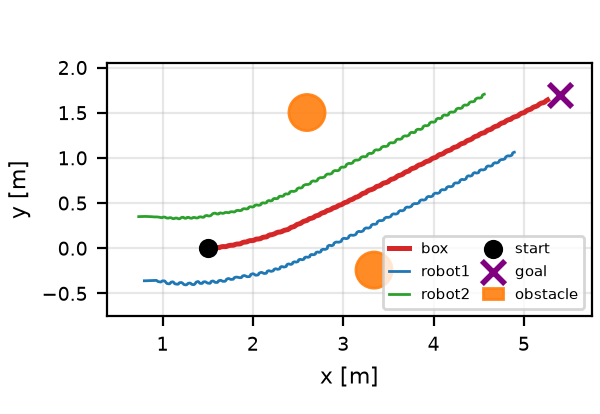

Converges in 38.6±0.8 s (N=10 trial mean±SD) with the box's true rotated-footprint clearance at 0.02 m to the obstacle's physical radius — a graze at the density constraint's own worst-case Minkowski boundary, with no velocity discontinuity at closest approach, confirming a true near-miss rather than a hard collision. Both the box-level and robot-level density constraints are active for this result.
Triple-quadruped — N=3 robots, gap D = 2.50 m
clearance 0.04 m · t_conv 28.5±1.0 s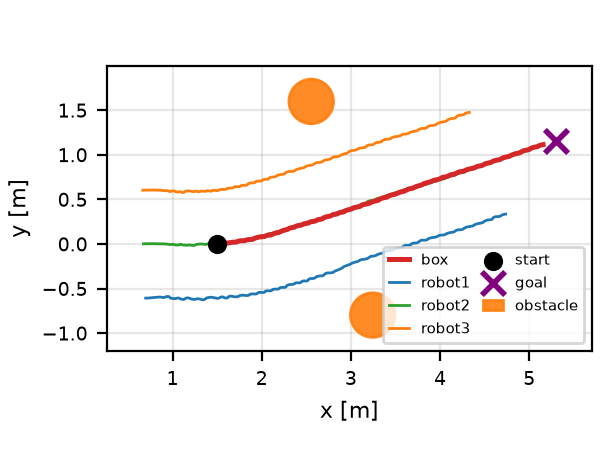

Converges in 28.5±1.0 s (N=10 trial mean±SD) with clearance 0.04 m — going from 2 to 3 contacts and a heavier, geometrically distinct T-box required no change to the box-level MPC formulation, only per-scenario contact geometry and inertial parameters.
Main results table
| Scenario (N) | D (m) | tconv (s), N=10 mean | ρb,peak | Clearance (m) |
|---|---|---|---|---|
| Dual-quadruped (2) | 1.90 | 38.6 ± 0.8 | 20.0 | 0.02 |
| Triple-quadruped (3) | 2.50 | 28.5 ± 1.0 | 20.0 | 0.04 |
Clearance is the worst-case distance from the box's true rotated footprint to each obstacle's physical radius over the whole run, not a center-distance proxy.
Controller-performance ablation
| Scenario | N (solves) | Solve time (ms) | Effort/step (N²m²) | Sep. (m) | Pos. RMSE (m) | Vel. RMSE (m/s) |
|---|---|---|---|---|---|---|
| Dual-quadruped | 760 | 15.55 ± 2.39 | 887.7 ± 145.9 | 0.708 ± 0.041 | 0.0038 | 0.0388 |
| Triple-quadruped | 569 | 16.98 ± 2.25 | 1250.5 ± 255.4 | 0.603 ± 0.007 | 0.0043 | 0.0367 |
Solve time and effort/step are mean±SD over genuine box-level MPC solve events (449 and 377 successful solves, respectively). Box-level solve time reflects solver reuse and state warm-starting, down from an earlier ~353 ms/solve figure before that optimization. Robot-level (leg) NMPC solves in 1.54±0.26 ms and 1.47±0.25 ms per robot for the two-robot team, and 1.56±0.24, 1.50±0.24, and 1.50±0.23 ms for the three-robot team. Peak density ρb,peak = 20.0 in both scenarios (reported as a point value, not mean±SD, since it is a worst-case bound rather than a typical-case cost). The measured computation times support the target implementation with object-level MPC at 20 Hz and robot-level MPC at 100 Hz; these rates remain to be validated on the target hardware, including end-to-end latency and deadline-miss handling.
Robot-level density constraint ablation
A second ablation isolates the robot-level density constraint, independent of the box-level avoidance above. All three scenarios converge with the constraint enabled (both levels active) as well as disabled; an extra active safety constraint is not free, so solve time and separation shift slightly rather than uniformly improving. "Dual, D=1.90m" and "Triple, D=2.50m" are the same two headline scenarios reported in the Main Results and Controller-performance tables above — their enabled row is repeated below for direct comparison against disabled. "Dual, D=2.20m" is an additional gap-width variant not used elsewhere on this page, so both its rows are shown in full.
| Scenario | Constraint | Compl. (s) | Solve (ms) | Sep. (m) |
|---|---|---|---|---|
| Dual, D=2.20m (additional variant) | disabled | 31.93 | 917.7 ± 548.1 | 0.729 ± 0.009 |
| enabled (Ours) | 31.44 | 1270.4 ± 755.9 | 0.723 ± 0.018 | |
| Dual, D=1.90m (headline scenario) | disabled | 37.35 | 1546.6 ± 1013.3 | 0.730 ± 0.012 |
| enabled (Ours) | 38.50 | 15.55 ± 2.39 | 0.708 ± 0.041 | |
| Triple, D=2.50m (headline scenario) | disabled | 28.16 | 2548.5 ± 1887.2 | 0.605 ± 0.003 |
| enabled (Ours) | 28.92 | 16.98 ± 2.25 | 0.603 ± 0.007 |
Completion time is a single event per run (the moment the box reaches the goal), so each cell is one number; solve time and separation are instead sampled at every control step across that same run (hundreds of samples over the ~30–60 s), so their ± here is within-run sample variability, not a trial-to-trial statistic — a different, older quantity from the N=10 trial-to-trial ± reported elsewhere on the page. The enabled rows also show completion time moving oppositely with team size (38.50s at N=2 against 28.92s at N=3), not an isolated team-size effect. The D=1.90m and D=2.50m "enabled (Ours)" solve times match the Controller-performance table above (same headline runs); their completion times are that same run's single deterministic-run figure, shown here on equal footing with the "disabled" column rather than as the N=10 trial mean (Main Results/Baseline Comparison report the N=10 mean±SD for these same runs, 38.6±0.8s and 28.5±1.0s respectively). D=2.20m's rows and both "disabled" rows are shown at their original, pre-optimization solve times, since that specific configuration hasn't been re-run since.
Additional scenario variants
Beyond the two headline gap-crossing results above, the same architecture was exercised on a range of obstacle layouts and maneuvers, at both team sizes. A curated subset is shown below — near-duplicate parameter sweeps, compressed re-encodes, and scratch/dev-iteration outputs are omitted (see report notes).
Dual-quadruped (N = 2)
2 Go2 robots, rectangular box.
Single obstacle, U-turn avoidance
Canonical single-obstacle demo: a dramatic, controlled U-turn (yaw peaks ~36°) around one obstacle, vs. a full spin (112°) with avoidance disabled. Rerun with a closed perimeter wall added to the arena.
Two-obstacle gap crossing
The original two-obstacle gap demo the headline D=1.90m result was tightened from, rerun with a closed perimeter wall around the arena.
Tighter gap, D = 2.20 m
An intermediate gap width between the original and the D=1.90m headline result, rerun with a closed perimeter wall around the arena.
Opposite-side double-obstacle traverse
Two obstacles placed on opposite sides of the direct path, forcing the box to turn one way then the other before reaching the goal, inside a closed perimeter wall.
Same-side double-obstacle U-turn
Two obstacles placed on the same side of the direct path, requiring the box to trace a single continuous U-turn around both before reaching the goal, inside a closed perimeter wall.
Triple-quadruped (N = 3)
3 Go2 robots, heavier T-box.
Single obstacle demo
Three-robot team pushing the T-box past one static obstacle, rerun with a closed perimeter wall around the arena.
Wider gap, D = 2.89 m
The wider precursor gap the D=2.50m headline result was later tightened (~14%) from, rerun with a closed perimeter wall around the arena.
Gap crossing + large turn
Gap-crossing geometry combined with an additional large heading change en route to goal.
Opposite-side double-obstacle traverse
Two obstacles placed on opposite sides of the direct path, forcing the T-box to turn one way then the other before reaching the goal, inside a closed perimeter wall.
Same-side double-obstacle U-turn
Two obstacles placed on the same side of the direct path, requiring the T-box to trace a single continuous U-turn around both before reaching the goal, inside a closed perimeter wall.
Density MPC vs. CBF MPC and RRT*-plus-tracking
Two baselines are run through the identical pipeline. CBF MPC (following Zeng, Zhang & Sreenath, ACC 2021) swaps the box-level MPC's density constraint for one discrete-time CBF constraint per obstacle (same dynamics, cost, and fixed contact offsets), tested on both scenarios. RRT*-plus-tracking (Karaman & Frazzoli, 2011) plans a path once per scenario, inflated by the box's footprint and obstacle radius plus a safety pad, then converts it to a pure-pursuit reference fed to the same box- and robot-level MPCs with density avoidance disabled — obstacle avoidance delegated entirely to the planned path, as in a conventional plan-then-track pipeline. RRT*-plus-tracking reduces the initial goal distance by only 38% and 41% (dual-/triple-quadruped) before stalling, commanded forces collapsing toward zero on every robot while heading drifts. Each method was additionally re-run 10 times per scenario under a small random start-pose perturbation (±0.05 m position, ±3° heading) to check robustness beyond the single deterministic run.
CBF MPC, dual-quadruped
Headline D=1.90 m gap scenario under CBF MPC. This single run converges, with density MPC completing this scenario 22.5% faster — but over 10 trials with a small start-pose perturbation, CBF MPC only reaches the goal 5/10 times here, against 10/10 for density MPC.
CBF MPC, triple-quadruped
Headline D=2.50 m gap scenario under CBF MPC. It also converges, with density MPC completing this scenario 6.3% faster — and remains fully robust, 10/10, over the same 10-trial perturbation check.
RRT*+tracking, dual-quadruped
Headline D=1.90 m gap scenario under RRT*-plus-tracking (identical MPCs, density avoidance disabled) — the exact geometry the table below's numbers are measured on.
RRT*+tracking, triple-quadruped
Headline D=2.50 m gap scenario under RRT*-plus-tracking (identical MPCs, density avoidance disabled) — the exact geometry the table below's numbers are measured on.
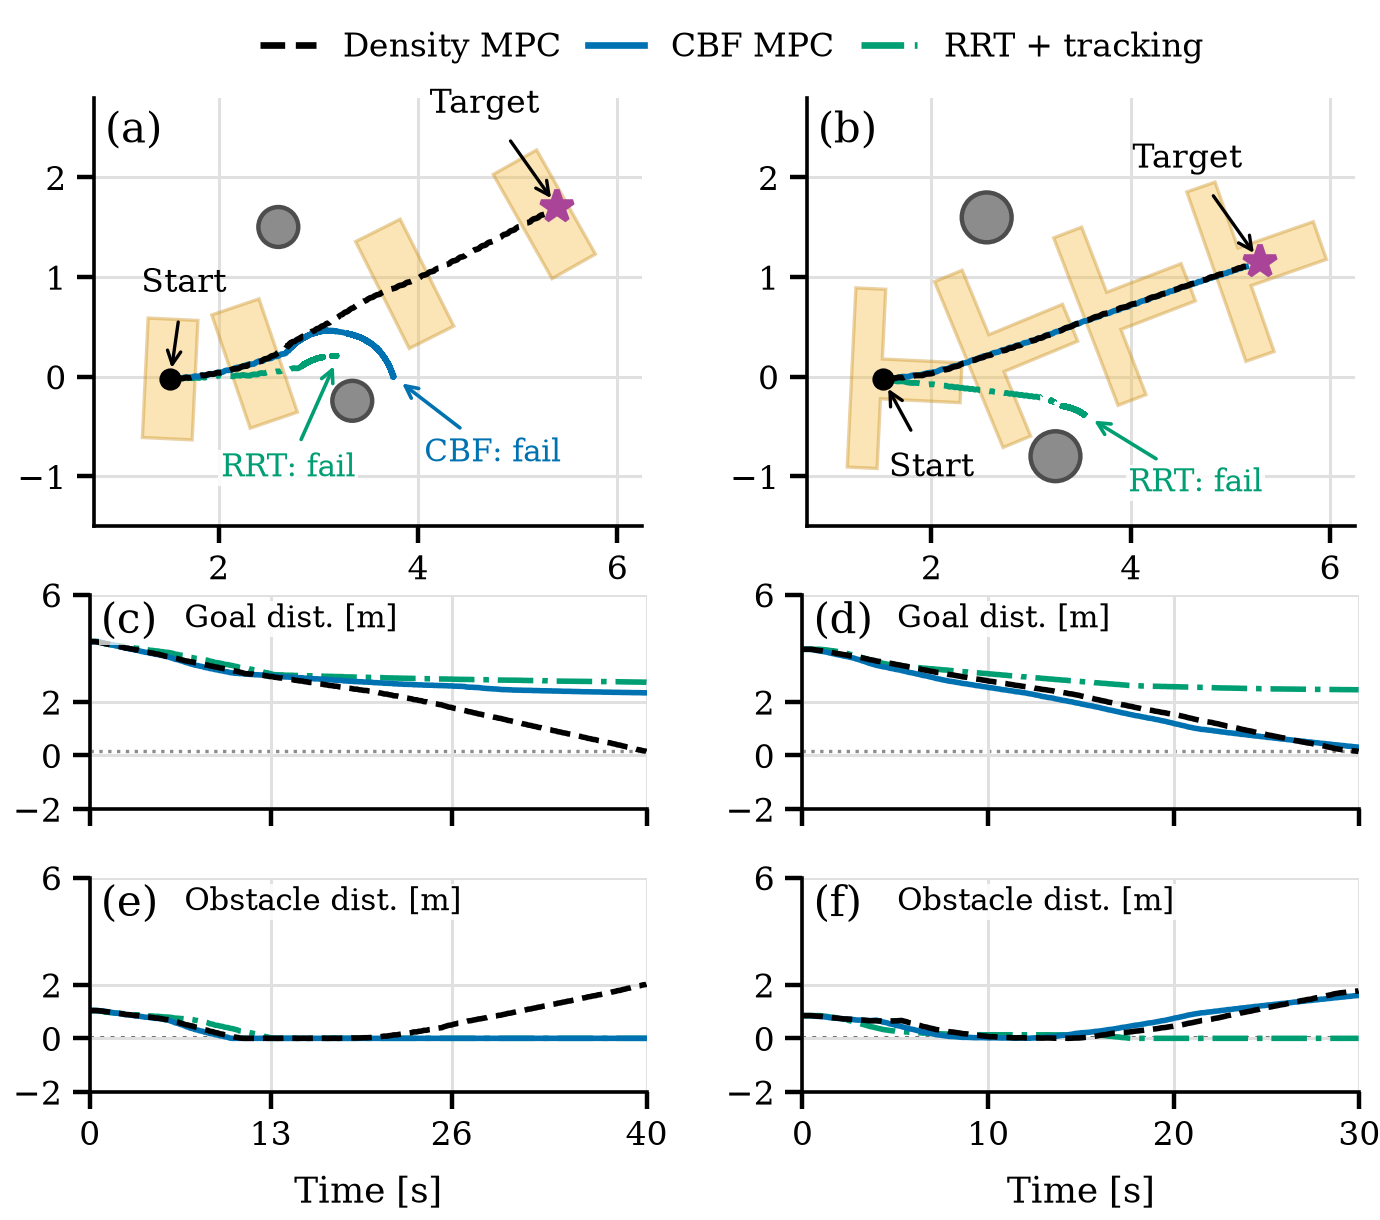
| Method | Success | Time (s) | Min. clearance (m) |
|---|---|---|---|
| Box pushing (n=2) | |||
| Density MPC | 10/10 | 38.6 ± 0.8 | 0.006 ± 0.009 |
| CBF MPC | 5/10 | 48.0 ± 0.7 | 0.000 ± 0.002 |
| RRT* + tracking | 0/10 | — | −0.001 ± 0.000 |
| T-shape pushing (n=3) | |||
| Density MPC | 10/10 | 28.5 ± 1.0 | 0.040 ± 0.017 |
| CBF MPC | 10/10 | 31.1 ± 0.8 | 0.049 ± 0.022 |
| RRT* + tracking | 0/10 | — | −0.001 ± 0.000 |
Success, completion time, and clearance (mean±SD) are over N=10 trials/method with the robots' start pose independently perturbed each trial, matching Table II in the paper; box-level solve time and RRT* yaw drift are each from that method's own single deterministic run instead. With solver reuse and state warm-starting, density MPC's own box-level solve time is 15.55±2.39 ms (dual-quad) and 16.98±2.25 ms (triple-quad); CBF MPC's box-level solve, measured separately (not re-optimized), was 834.6±433.7 ms (dual-quad) and 661.2±404.3 ms (triple-quad). The RRT* baseline's heading drifts by tens of degrees before stalling (−47.3° to 10.5° dual-quad, −67.6° to 0.3° triple-quad). CBF MPC citation: Zeng, Zhang & Sreenath, "Safety-Critical Model Predictive Control with Discrete-Time Control Barrier Function," ACC 2021. RRT* citation: Karaman & Frazzoli, "Sampling-based Algorithms for Optimal Motion Planning," IJRR 2011.
Does synchronizing the robots' gait phase matter?
Gait synchronization, all robots sharing the same stance/swing timing rather than drifting independently, was raised as a way to smooth the commanded push force. Checking the implementation first, both robots' gait generators already share an identical, deterministic phase offset with no per-robot frequency adaptation enabled, so the two are phase-locked by construction, before any explicit synchronization mechanism is added. The comparison condition deliberately offsets one robot's phase by half a gait cycle.
Phase-locked (default)
Headline D=1.90 m dual-quadruped scenario, both robots' gait generators sharing an identical phase, the default used for every other result on this page.
Half-cycle offset
Same scenario, one robot's gait phase deliberately offset by half a cycle, the comparison condition.
| Metric | Phase-locked (default) | Half-cycle offset |
|---|---|---|
| Convergence time (s) | 38.50 | 37.90 |
| Push-force coeff. of variation (%) | 78.1 | 84.5 |
| Mean step-to-step force change (N) | 13.09 | 13.89 |
| |f1−f2| mean±SD (N) | 13.37 ± 13.16 | 12.41 ± 13.69 |
| Agent separation mean±SD (m) | 0.708 ± 0.041 | 0.696 ± 0.045 |
| Effort/step (N²m²) | 887.7 ± 145.9 | 893.6 ± 141.0 |
Convergence time was not meaningfully affected either way. Force-differential magnitude, agent separation, and control effort were also comparable between the two; the effect is specifically on the combined push force's temporal smoothness (coefficient of variation and step-to-step change), both modestly worse once desynced, a small but directionally consistent effect, not a large one. The "Phase-locked (default)" column is the same dual-quadruped headline run reported in the Controller-performance table above (its agent-separation and effort/step values, 0.708±0.041 m and 887.7±145.9 N²m², are identical here), shown again in full so both gait-sync conditions can be compared side by side in one table. Its convergence time (38.50 s) is that same single deterministic run's value, shown here on equal footing with the half-cycle-offset column's 37.90 s (also a single deterministic run, since that condition wasn't included in the N=10 perturbation campaign) rather than as the N=10 trial mean; Main Results/Baseline Comparison report this run's N=10 mean±SD instead, 38.6±0.8 s.